Store Halfword Byte-Reverse Indexed

A Power Technical Blog

memcmp() for POWER8 - part II

This entry is a followup to part I which you should absolutely read here before continuing on.

Where we left off

We concluded that while a vectorised memcmp() is a win, there are some cases where it won't quite perform.

The overhead of enabling ALTIVEC

In the kernel we explicitly don't touch ALTIVEC unless we need to, this means that in the general case we can leave the userspace registers in place and not have do anything to service a syscall for a process.

This means that if we do want to use ALTIVEC in the kernel, there is some setup that must be done. Notably, we must enable the facility (a potentially time consuming move to MSR), save off the registers (if userspace we using them) and an inevitable restore later on.

If all this needs to be done for a memcmp() in the order of tens of bytes then it really wasn't worth it.

There are two reasons that memcmp() might go for a small number of bytes, firstly and trivially detectable is simply that parameter n is small. The other is harder to detect, if the memcmp() is going to fail (return non zero) early then it also wasn't worth enabling ALTIVEC.

Detecting early failures

Right at the start of memcmp(), before enabling ALTIVEC, the first 64 bytes are checked using general purpose registers. Why the first 64 bytes, well why not? In a strange twist of fate 64 bytes happens to be the amount of bytes in four ALTIVEC registers (128 bits per register, so 16 bytes multiplied by 4) and by utter coincidence that happens to be the stride of the ALTIVEC compare loop.

What does this all look like

Well unlike part I the results appear slightly less consistent across three runs of measurement but there are some very key differences with part I. The trends do appear to be the same across all three runs, just less pronounced - why this is is unclear.

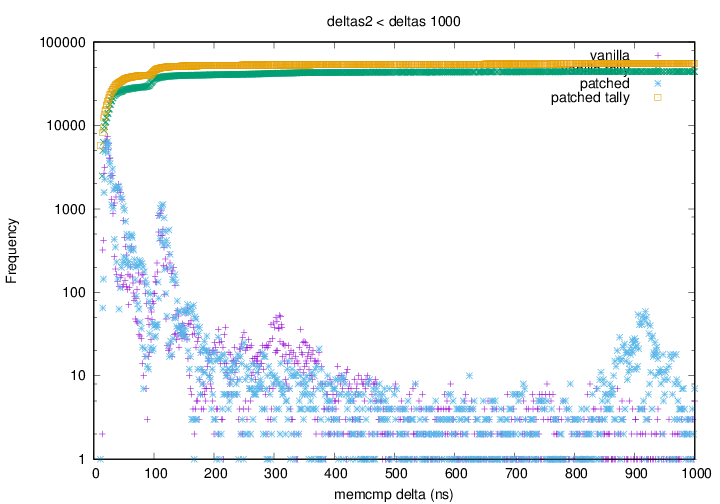
The difference between run two and run three clipped at deltas of 1000ns is interesting: Sample 2: Deltas below 1000ns

vs

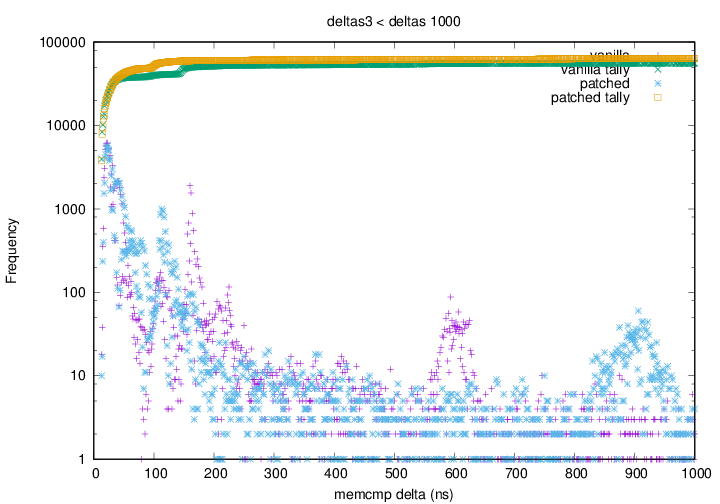
Sample 3: Deltas below 1000ns

The results are similar except for a spike in the amount of deltas in the unpatched kernel at around 600ns. This is not present in the first sample (deltas1) of data. There are a number of reasons why this spike could have appeared here, it is possible that the kernel or hardware did something under the hood, prefetch could have brought deltas for a memcmp() that would otherwise have yielded a greater delta into the 600ns range.

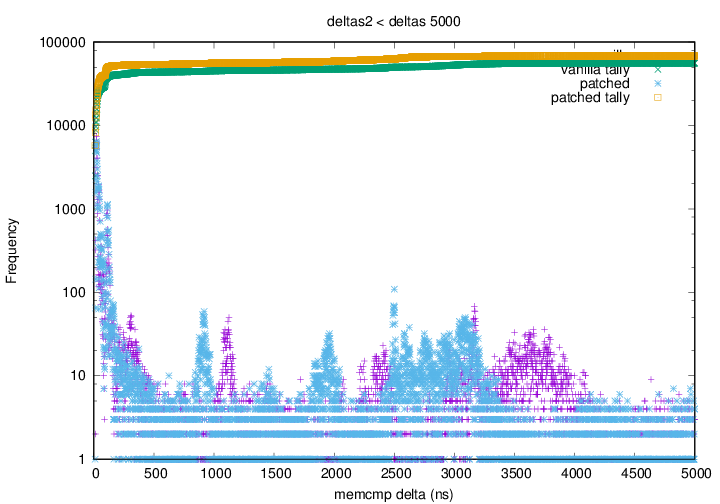
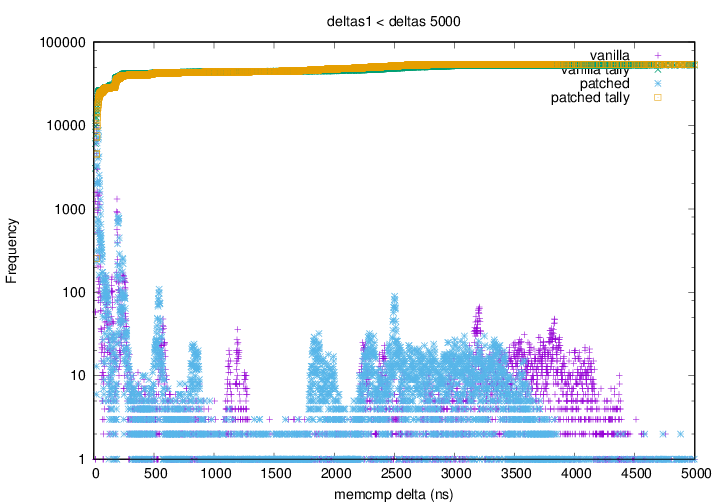
What these two graphs do both demonstrate quite clearly is that optimisations down at the sub 100ns end have resulted in more sub 100ns deltas for the patched kernel, a significant win over the original data. Zooming out and looking at a graph which includes deltas up to 5000ns shows that the sub 100ns delta optimisations haven't noticeably slowed the performance of long duration memcmp(), Samply 2: Deltas below 5000ns.

Conclusion

The small amount of extra development effort has yielded tangible results in reducing the low end memcmp() times. This second round of data collection and performance analysis only confirms the that for any significant amount of comparison, a vectorised loop is significantly quicker.

The results obtained here show no downside to adopting this approach for all power8 and onwards chips as this new version of the patch solves the performance regression for small compares.

memcmp() for POWER8

Userspace

When writing C programs in userspace there is libc which does so much of the heavy lifting. One important thing libc provides is portability in performing syscalls, that is, you don't need to know the architectural details of performing a syscall on each architecture your program might be compiled for. Another important feature that libc provides for the average userspace programmer is highly optimised routines to do things that are usually performance critical. It would be extremely inefficient for each userspace programmer if they had to implement even the naive version of these functions let alone optimised versions. Let us take memcmp() for example, I could trivially implement this in C like:

int memcmp(uint8_t *p1, uint8_t *p2, int n)
{
    int i;

    for (i = 0; i < n; i++) {
        if (p1[i] < p2[i])
            return -1;
        if (p1[i] > p2[i])
            return 1;
    }

    return 0;
}

However, while it is incredibly portable it is simply not going to perform, which is why the nice people who write libc have highly optimised ones in assembly for each architecture.

Kernel

When writing code for the Linux kernel, there isn't the luxury of a fully featured libc since it expects (and needs) to be in userspace, therefore we need to implement the features we need ourselves. Linux doesn't need all the features but something like memcmp() is definitely a requirement.

There have been some recent optimisations in glibc from which the kernel could benefit too! The question to be asked is, does the glibc optimised power8_memcmp() actually go faster or is it all smoke and mirrors?

Benchmarking memcmp()

With things like memcmp() it is actually quite easy to choose datasets which can make any implementation look good. For example; the new power8_memcmp() makes use of the vector unit of the power8 processor, in order to do so in the kernel there must be a small amount of setup code so that the rest of the kernel knows that the vector unit has been used and it correctly saves and restores the userspace vector registers. This means that power8_memcmp() has a slightly larger overhead than the current one, so for small compares or compares which are different early on then the newer 'faster' power8_memcmp() might actually not perform as well. For any kind of large compare however, using the vector unit should outperform a CPU register load and compare loop. It is for this reason that I wanted to avoid using micro benchmarks and use a 'real world' test as much as possible.

The biggest user of memcmp() in the kernel, at least on POWER is Kernel Samepage Merging (KSM). KSM provides code to inspect all the pages of a running system to determine if they're identical and deduplicate them if possible. This kind of feature allows for memory overcommit when used in a KVM host environment as guest kernels are likely to have a lot of similar, readonly pages which can be merged with no overhead afterwards. In order to determine if the pages are the same KSM must do a lot of page sized memcmp().

Performance

Performing a lot of page sized memcmp() is the one flaw with this test, the sizes of the memcmp() don't vary, hopefully the data will be 'random' enough that we can still observe differences in the two approaches.

My approach for testing involved getting the delta of ktime_get() across calls to memcmp() in memcmp_pages() (mm/ksm.c). This actually generated massive amounts of data, so, for consistency the following analysis is performed on the first 400MB of deltas collected.

The host was compiled with powernv_defconfig and run out of a ramdisk. For consistency the host was rebooted between each run so as to not have any previous tests affect the next. The host was rebooted a total of six times, the first three with my 'patched' power8_memcmp() kernel was booted the second three times with just my data collection patch applied, the 'vanilla' kernel. Both kernels are based off 4.13-rc3.

Each boot the following script was run and the resulting deltas file saved somewhere before reboot. The command line argument was always 15.

#!/bin/sh

ppc64_cpu --smt=off

#Host actually boots with ksm off but be sure
echo 0 > /sys/kernel/mm/ksm/run

#Scan a lot of pages
echo 999999 > /sys/kernel/mm/ksm/pages_to_scan

echo "Starting QEMUs"
i=0
while [ "$i" -lt "$1" ] ; do
    qemu-system-ppc64 -smp 1 -m 1G -nographic -vga none \
        -machine pseries,accel=kvm,kvm-type=HV \
        -kernel guest.kernel  -initrd guest.initrd \
        -monitor pty -serial pty &
    i=$(expr $i + 1);
done

echo "Letting all the VMs boot"
sleep 30

echo "Turning KSM om"
echo 1 > /sys/kernel/mm/ksm/run

echo "Letting KSM do its thing"
sleep 2m

echo 0 > /sys/kernel/mm/ksm/run

dd if=/sys/kernel/debug/ksm/memcmp_deltas of=deltas bs=4096 count=100

The guest kernel was a pseries_le_defconfig 4.13-rc3 with the same ramdisk the host used. It booted to the login prompt and was left to idle.

Analysis

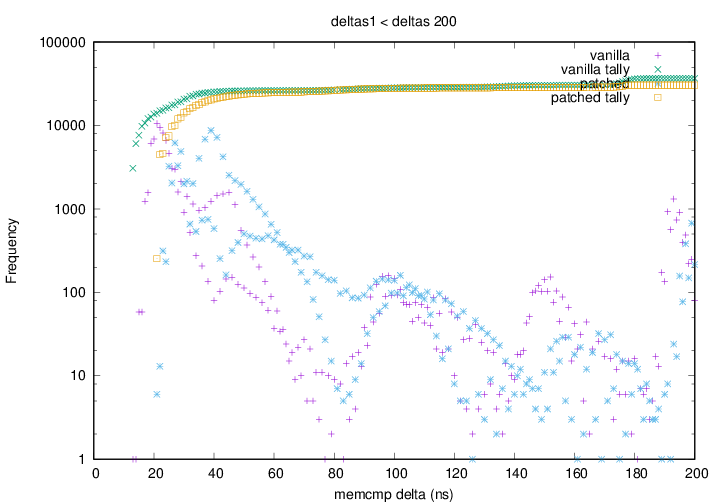
A variety of histograms were then generated in an attempt to see how the behaviour of memcmp() changed between the two implementations. It should be noted here that the y axis in the following graphs is a log scale as there were a lot of small deltas. The first observation is that the vanilla kernel had more smaller deltas, this is made particularly evident by the 'tally' points which are a running total of all deltas with less than the tally value.

Sample 1 - Deltas below 200ns Graph 1 depicting the vanilla kernel having a greater amount of small (sub 20ns) deltas than the patched kernel. The green points rise faster (left to right) and higher than the yellow points.
Still looking at the tallies, graph 1 also shows that the tally of deltas is very close by the 100ns mark, which means that the overhead of power8_memcmp() is not too great.

The problem with looking at only deltas under 200ns is that the performance results we want, that is, the difference between the algorithms is being masked by things like cache effects. To avoid this problem is may be wise to look at longer running (larger delta) memcmp() calls.

The following graph plots all deltas below 5000ns - still relatively short calls to memcmp() but an interesting trend emerges: Sample 1 - Deltas below 5000ns Graph 2 shows that above 500ns the blue (patched kernel) points appear to have all shifted left with respect to the purple (vanilla kernel) points. This shows that for any memcmp() which will take more than 500ns to get a result it is favourable to use power8_memcmp() and it is only detrimental to use power8_memcmp() if the time will be under 50ns (a conservative estimate).

It is worth noting that graph 1 and graph 2 are generated by combining the first run of data collected from the vanilla and patched kernels. All the deltas for both runs are can be viewed separately here for vanilla and here for patched. Finally, the results from the other four runs look very much identical and provide me with a fair amount of confidence that these results make sense.

Conclusions

It is important to separate possible KSM optimisations with generic memcmp() optimisations, for example, perhaps KSM shouldn't be calling memcmp() if it suspects the first byte will differ. On the other hand, things that power8_memcmp() could do (which it currently doesn't) is check the length parameter and perhaps avoid the overhead of enabling kernel vector if the compare is less than some small amount of bytes.

It does seem like at least for the 'average case' glibcs power8_memcmp() is an improvement over what we have now.

Future work

A second round of data collection and plotting of delta vs position of first byte to differ should confirm these results, this would mean a more invasive patch to KSM.

XDP on Power

This post is a bit of a break from the standard IBM fare of this blog, as I now work for Canonical. But I have a soft spot for Power from my time at IBM - and Canonical officially supports 64-bit, little-endian Power - so when I get a spare moment I try to make sure that cool, officially-supported technologies work on Power before we end up with a customer emergency! So, without further ado, this is the story of XDP on Power.

XDP

eXpress Data Path (XDP) is a cool Linux technology to allow really fast processing of network packets.

Normally in Linux, a packet is received by the network card, an SKB (socket buffer) is allocated, and the packet is passed up through the networking stack.

This introduces an inescapable latency penalty: we have to allocate some memory and copy stuff around. XDP allows some network cards and drivers to process packets early - even before the allocation of the SKB. This is much faster, and so has applications in DDOS mitigation and other high-speed networking use-cases. The IOVisor project has much more information if you want to learn more.

eBPF

XDP processing is done by an eBPF program. eBPF - the extended Berkeley Packet Filter - is an in-kernel virtual machine with a limited set of instructions. The kernel can statically validate eBPF programs to ensure that they terminate and are memory safe. From this it follows that the programs cannot be Turing-complete: they do not have backward branches, so they cannot do fancy things like loops. Nonetheless, they're surprisingly powerful for packet processing and tracing. eBPF programs are translated into efficient machine code using in-kernel JIT compilers on many platforms, and interpreted on platforms that do not have a JIT. (Yes, there are multiple JIT implementations in the kernel. I find this a terrifying thought.)

Rather than requiring people to write raw eBPF programs, you can write them in a somewhat-restricted subset of C, and use Clang's eBPF target to translate them. This is super handy, as it gives you access to the kernel headers - which define a number of useful data structures like headers for various network protocols.

Trying it

There are a few really interesting project that are already up and running that allow you to explore XDP without learning the innards of both eBPF and the kernel networking stack. I explored the samples in the bcc compiler collection and also the samples from the netoptimizer/prototype-kernel repository.

The easiest way to get started with these is with a virtual machine, as recent virtio network drivers support XDP. If you are using Ubuntu, you can use the uvt-kvm tooling to trivially set up a VM running Ubuntu Zesty on your local machine.

Once your VM is installed, you need to shut it down and edit the virsh XML.

You need 2 vCPUs (or more) and a virtio+vhost network card. You also need to edit the 'interface' section and add the following snippet (with thanks to the xdp-newbies list):

<driver name='vhost' queues='4'>
    <host tso4='off' tso6='off' ecn='off' ufo='off'/>
    <guest tso4='off' tso6='off' ecn='off' ufo='off'/>
</driver>

(If you have more than 2 vCPUs, set the queues parameter to 2x the number of vCPUs.)

Then, install a modern clang (we've had issues with 3.8 - I recommend v4+), and the usual build tools.

I recommend testing with the prototype-kernel tools - the DDOS prevention tool is a good demo. Then - on x86 - you just follow their instructions. I'm not going to repeat that here.

POWERful XDP

What happens when you try this on Power? Regular readers of my posts will know to expect some minor hitches.

XDP does not disappoint.

Firstly, the prototype-kernel repository hard codes x86 as the architecture for kernel headers. You need to change it for powerpc.

Then, once you get the stuff compiled, and try to run it on a current-at-time-of-writing Zesty kernel, you'll hit a massive debug splat ending in:

32: (61) r1 = *(u32 *)(r8 +12)
misaligned packet access off 0+18+12 size 4
load_bpf_file: Permission denied

It turns out this is because in Ubuntu's Zesty kernel, CONFIG_HAS_EFFICIENT_UNALIGNED_ACCESS is not set on ppc64el. Because of that, the eBPF verifier will check that all loads are aligned - and this load (part of checking some packet header) is not, and so the verifier rejects the program. Unaligned access is not enabled because the Zesty kernel is being compiled for CPU_POWER7 instead of CPU_POWER8, and we don't have efficient unaligned access on POWER7.

As it turns out, IBM never released any officially supported Power7 LE systems - LE was only ever supported on Power8. So, I filed a bug and sent a patch to build Zesty kernels for POWER8 instead, and that has been accepted and will be part of the next stable update due real soon now.

Sure enough, if you install a kernel with that config change, you can verify the XDP program and load it into the kernel!

If you have real powerpc hardware, that's enough to use XDP on Power! Thanks to Michael Ellerman, maintainer extraordinaire, for verifying this for me.

If - like me - you don't have ready access to Power hardware, you're stuffed. You can't use qemu in TCG mode: to use XDP with a VM, you need multi-queue support, which only exists in the vhost driver, which is only available for KVM guests. Maybe IBM should release a developer workstation. (Hint, hint!)

Overall, I was pleasantly surprised by how easy things were for people with real ppc hardware - it's encouraging to see something not require kernel changes!

eBPF and XDP are definitely growing technologies - as Brendan Gregg notes, now is a good time to learn them! (And those on Power have no excuse either!)

Evaluating CephFS on Power

Methodology

To evaluate CephFS, we will create a ppc64le virtual machine, with sufficient space to compile the software, as well as 3 sparse 1TB disks to create the object store.

We will then build & install the Ceph packages, after adding the PowerPC optimisiations to the code. This is done, as ceph-deploy will fetch prebuilt packages that do not have the performance patches if the packages are not installed.

Finally, we will use the ceph-deploy to deploy the instance. We will ceph-deploy via pip, to avoid file conflicts with the packages that we built.

For more information on what each command does, visit the following tutorial, upon which which this is based: http://palmerville.github.io/2016/04/30/single-node-ceph-install.html

Virtual Machine Config

Create a virtual machine with at least the following: - 16GB of memory - 16 CPUs - 64GB disk for the root filesystem - 3 x 1TB for the Ceph object store - Ubuntu 16.04 default install (only use the 64GB disk, leave the others unpartitioned)

Initial config

  • Enable ssh
    sudo apt install openssh-server
    sudo apt update
    sudo apt upgrade
    sudo reboot
  • Install build tools
    sudo apt install git debhelper

Build Ceph

    mkdir $HOME/src
    cd $HOME/src
    git clone --recursive https://github.com/ceph/ceph.git  # This may take a while
    cd ceph
    git checkout master
    git submodule update --force --init --recursive
  • Cherry-pick the Power performance patches:
    git remote add kestrels https://github.com/kestrels/ceph.git
    git fetch --all
    git cherry-pick 59bed55a676ebbe3ad97d8ec005c2088553e4e11
  • Install prerequisites
    ./install-deps.sh
    sudo apt install python-requests python-flask resource-agents curl python-cherrypy python3-pip python-django python-dateutil python-djangorestframework
    sudo pip3 install ceph-deploy
    cd $HOME/src/ceph
    sudo dpkg-buildpackage -J$(nproc) # This will take a couple of hours (16 cpus)
  • Install the packages (note that python3-ceph-argparse will fail, but is safe to ignore)
    cd $HOME/src
    sudo dpkg -i *.deb

Create the ceph-deploy user

    sudo adduser ceph-deploy
    echo "ceph-deploy ALL = (root) NOPASSWD:ALL" | sudo tee /etc/sudoers.d/ceph-deploy
    sudo chmod 0440 /etc/sudoers.d/ceph-deploy

Configure the ceph-deploy user environment

    su - ceph-deploy
    ssh-keygen
    node=`hostname`
    ssh-copy-id ceph-deploy@$node
    mkdir $HOME/ceph-cluster
    cd $HOME/ceph-cluster
    ceph-deploy new $node # If this fails, remove the bogus 127.0.1.1 entry from /etc/hosts
    echo 'osd pool default size = 2' >> ceph.conf
    echo 'osd crush chooseleaf type = 0' >> ceph.conf

Complete the Ceph deployment

    ceph-deploy install $node
    ceph-deploy mon create-initial
    drives="vda vdb vdc"  # the 1TB drives - check that these are correct for your system
    for drive in $drives; do ceph-deploy disk zap $node:$drive; ceph-deploy osd prepare $node:$drive; done
    for drive in $drives; do ceph-deploy osd activate $node:/dev/${drive}1; done
    ceph-deploy admin $node
    sudo chmod +r /etc/ceph/ceph.client.admin.keyring
    ceph -s # Check the state of the cluster

Configure CephFS

    ceph-deploy mds create $node
    ceph osd pool create cephfs_data 128
    ceph osd pool create cephfs_metadata 128
    ceph fs new cephfs cephfs_metadata cephfs_data
    sudo systemctl status ceph\*.service ceph\*.target # Ensure the ceph-osd, ceph-mon & ceph-mds daemons are running
    sudo mkdir /mnt/cephfs
    key=`grep key ~/ceph-cluster/ceph.client.admin.keyring | cut -d ' ' -f 3`
    sudo mount -t ceph $node:6789:/ /mnt/cephfs -o name=admin,secret=$key

References

  1. http://docs.ceph.com/docs/master/install/clone-source/
  2. http://docs.ceph.com/docs/master/install/build-ceph/
  3. http://palmerville.github.io/2016/04/30/single-node-ceph-install.html

Erasure Coding for Programmers, Part 2

We left part 1 having explored GF(2^8) and RAID 6, and asking the question "what does all this have to do with Erasure Codes?"

Basically, the thinking goes "RAID 6 is cool, but what if, instead of two parity disks, we had an arbitrary number of parity disks?"

How would we do that? Well, let's introduce our new best friend: Coding Theory!

Say we want to transmit some data across an error-prone medium. We don't know where the errors might occur, so we add some extra information to allow us to detect and possibly correct for errors. This is a code. Codes are a largish field of engineering, but rather than show off my knowledge about systematic linear block codes, let's press on.

Today, our error-prone medium is an array of inexpensive disks. Now we make this really nice assumption about disks, namely that they are either perfectly reliable or completely missing. In other words, we consider that a disk will either be present or 'erased'. We come up with 'erasure codes' that are able to reconstruct data when it is known to be missing. (This is a slightly different problem to being able to verify and correct data that might or might not be subtly corrupted. Disks also have to deal with this problem, but it is not something erasure codes address!)

The particular code we use is a Reed-Solomon code. The specific details are unimportant, but there's a really good graphical outline of the broad concepts in sections 1 and 3 of the Jerasure paper/manual. (Don't go on to section 4.)

That should give you some background on how this works at a pretty basic mathematical level. Implementation is a matter of mapping that maths (matrix multiplication) onto hardware primitives, and making it go fast.

Scope

I'm deliberately not covering some pretty vast areas of what would be required to write your own erasure coding library from scratch. I'm not going to talk about how to compose the matricies, how to invert them, or anything like that. I'm not sure how that would be a helpful exercise - ISA-L and jerasure already exist and do that for you.

What I want to cover is an efficient implementation of the some algorithms, once you have the matricies nailed down.

I'm also going to assume your library already provides a generic multiplication function in GF(2^8). That's required to construct the matrices, so it's a pretty safe assumption.

The beginnings of an API

Let's make this a bit more concrete.

This will be heavily based on the ISA-L API but you probably want to plug into ISA-L anyway, so that shouldn't be a problem.

What I want to do is build up from very basic algorithmic components into something useful.

The first thing we want to do is to be able to is Galois Field multiplication of an entire region of bytes by an arbitrary constant.

We basically want gf_vect_mul(size_t len, <something representing the constant>, unsigned char * src, unsigned char * dest)

Simple and slow approach

The simplest way is to do something like this:

void gf_vect_mul_simple(size_t len, unsigned char c, unsigned char * src, unsigned char * dest) {

    size_t i;
    for (i=0; i<len; i++) {
        dest[i] = gf_mul(c, src[i]);
    }
}

That does multiplication element by element using the library's supplied gf_mul function, which - as the name suggests - does GF(2^8) multiplication of a scalar by a scalar.

This works. The problem is that it is very, painfully, slow - in the order of a few hundred megabytes per second.

Going faster

How can we make this faster?

There are a few things we can try: if you want to explore a whole range of different ways to do this, check out the gf-complete project. I'm going to assume we want to skip right to the end and know what is the fastest we've found.

Cast your mind back to the RAID 6 paper (PDF). I talked about in part 1. That had a way of doing an efficient multiplication in GF(2^8) using vector instructions.

To refresh your memory, we split the multiplication into two parts - low bits and high bits, looked them up separately in a lookup table, and joined them with XOR. We then discovered that on modern Power chips, we could do that in one instruction with vpermxor.

So, a very simple way to do this would be:

  • generate the table for a
  • for each 16-byte chunk of our input:
    • load the input
    • do the vpermxor with the table
    • save it out

Generating the tables is reasonably straight-forward, in theory. Recall that the tables are a * {{00},{01},...,{0f}} and a * {{00},{10},..,{f0}} - a couple of loops in C will generate them without difficulty. ISA-L has a function to do this, as does gf-complete in split-table mode, so I won't repeat them here.

So, let's recast our function to take the tables as an input rather than the constant a. Assume we're provided the two tables concatenated into one 32-byte chunk. That would give us:

void gf_vect_mul_v2(size_t len, unsigned char * table, unsigned char * src, unsigned char * dest)

Here's how you would do it in C:

void gf_vect_mul_v2(size_t len, unsigned char * table, unsigned char * src, unsigned char * dest) {
        vector unsigned char tbl1, tbl2, in, out;
        size_t i;

        /* Assume table, src, dest are aligned and len is a multiple of 16 */

        tbl1 = vec_ld(16, table);
        tbl2 = vec_ld(0, table);
        for (i=0; i<len; i+=16) {
            in = vec_ld(i, (unsigned char *)src);
            __asm__("vpermxor %0, %1, %2, %3" : "=v"(out) : "v"(tbl1), "v"(tbl2), "v"(in)
            vec_st(out, i, (unsigned char *)dest);
        }
}

There's a few quirks to iron out - making sure the table is laid out in the vector register in the way you expect, etc, but that generally works and is quite fast - my Power 8 VM does about 17-18 GB/s with non-cache-contained data with this implementation.

We can go a bit faster by doing larger chunks at a time:

    for (i=0; i<vlen; i+=64) {
            in1 = vec_ld(i, (unsigned char *)src);
            in2 = vec_ld(i+16, (unsigned char *)src);
            in3 = vec_ld(i+32, (unsigned char *)src);
            in4 = vec_ld(i+48, (unsigned char *)src);
            __asm__("vpermxor %0, %1, %2, %3" : "=v"(out1) : "v"(tbl1), "v"(tbl2), "v"(in1));
            __asm__("vpermxor %0, %1, %2, %3" : "=v"(out2) : "v"(tbl1), "v"(tbl2), "v"(in2));
            __asm__("vpermxor %0, %1, %2, %3" : "=v"(out3) : "v"(tbl1), "v"(tbl2), "v"(in3));
            __asm__("vpermxor %0, %1, %2, %3" : "=v"(out4) : "v"(tbl1), "v"(tbl2), "v"(in4));
            vec_st(out1, i, (unsigned char *)dest);
            vec_st(out2, i+16, (unsigned char *)dest);
            vec_st(out3, i+32, (unsigned char *)dest);
            vec_st(out4, i+48, (unsigned char *)dest);
    }

This goes at about 23.5 GB/s.

We can go one step further and do the core loop in assembler - that means we control the instruction layout and so on. I tried this: it turns out that for the basic vector multiply loop, if we turn off ASLR and pin to a particular CPU, we can see a improvement of a few percent (and a decrease in variability) over C code.

Building from vector multiplication

Once you're comfortable with the core vector multiplication, you can start to build more interesting routines.

A particularly useful one on Power turned out to be the multiply and add routine: like gf_vect_mul, except that rather than overwriting the output, it loads the output and xors the product in. This is a simple extension of the gf_vect_mul function so is left as an exercise to the reader.

The next step would be to start building erasure coding proper. Recall that to get an element of our output, we take a dot product: we take the corresponding input element of each disk, multiply it with the corresponding GF(2^8) coding matrix element and sum all those products. So all we need now is a dot product algorithm.

One approach is the conventional dot product:

  • for each element
    • zero accumulator
    • for each source
      • load input[source][element]
      • do GF(2^8) multiplication
      • xor into accumulator
    • save accumulator to output[element]

The other approach is multiply and add:

  • for each source
    • for each element
      • load input[source][element]
      • do GF(2^8) multiplication
      • load output[element]
      • xor in product
      • save output[element]

The dot product approach has the advantage of fewer writes. The multiply and add approach has the advantage of better cache/prefetch performance. The approach you ultimately go with will probably depend on the characteristics of your machine and the length of data you are dealing with.

For what it's worth, ISA-L ships with only the first approach in x86 assembler, and Jerasure leans heavily towards the second approach.

Once you have a vector dot product sorted, you can build a full erasure coding setup: build your tables with your library, then do a dot product to generate each of your outputs!

In ISA-L, this is implemented something like this:

/*
 * ec_encode_data_simple(length of each data input, number of inputs,
 *                       number of outputs, pre-generated GF(2^8) tables,
 *                       input data pointers, output code pointers)
 */
void ec_encode_data_simple(int len, int k, int rows, unsigned char *g_tbls,
                           unsigned char **data, unsigned char **coding)
{
        while (rows) {
                gf_vect_dot_prod(len, k, g_tbls, data, *coding);
                g_tbls += k * 32;
                coding++;
                rows--;
        }
}

Going faster still

Eagle eyed readers will notice that however we generate an output, we have to read all the input elements. This means that if we're doing a code with 10 data disks and 4 coding disks, we have to read each of the 10 inputs 4 times.

We could do better if we could calculate multiple outputs for each pass through the inputs. This is a little fiddly to implement, but does lead to a speed improvement.

ISA-L is an excellent example here. Intel goes up to 6 outputs at once: the number of outputs you can do is only limited by how many vector registers you have to put the various operands and results in.

Tips and tricks

  • Benchmarking is tricky. I do the following on a bare-metal, idle machine, with ASLR off and pinned to an arbitrary hardware thread. (Code is for the fish shell)

    for x in (seq 1 50)
        setarch ppc64le -R taskset -c 24 erasure_code/gf_vect_mul_perf
    end | awk '/MB/ {sum+=$13} END {print sum/50, "MB/s"}'
    
  • Debugging is tricky; the more you can do in C and the less you do in assembly, the easier your life will be.

  • Vector code is notoriously alignment-sensitive - if you can't figure out why something is wrong, check alignment. (Pro-tip: ISA-L does not guarantee the alignment of the gftbls parameter, and many of the tests supply an unaligned table from the stack. For testing __attribute__((aligned(16))) is your friend!)

  • Related: GCC is moving towards assignment over vector intrinsics, at least on Power:

    vector unsigned char a;
    unsigned char * data;
    // good, also handles word-aligned data with VSX
    a = *(vector unsigned char *)data;
    // bad, requires special handling of non-16-byte aligned data
    a = vec_ld(0, (unsigned char *) data);
    

Conclusion

Hopefully by this point you're equipped to figure out how your erasure coding library of choice works, and write your own optimised implementation (or maintain an implementation written by someone else).

I've referred to a number of resources throughout this series:

If you want to go deeper, I also read the following and found them quite helpful in understanding Galois Fields and Reed-Solomon coding:

For a more rigorous mathematical approach to rings and fields, a university mathematics course may be of interest. For more on coding theory, a university course in electronics engineering may be helpful.