Store Halfword Byte-Reverse Indexed

A Power Technical Blog

SROP Mitigation

What is SROP?

Sigreturn Oriented Programming - a general technique that can be used as an exploit, or as a backdoor to exploit another vulnerability.

Okay, but what is it?

Yeah... Let me take you through some relevant background info, where I skimp on the details and give you the general picture.

In Linux, software interrupts are called signals. More about signals here! Generally a signal will convey some information from the kernel and so most signals will have a specific signal handler (some code that deals with the signal) setup.

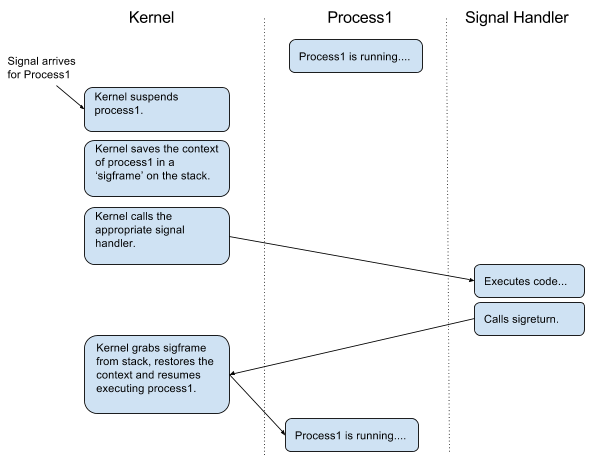
Signals are asynchronous - ie they can be sent to a process/program at anytime. When a signal arrives for a process, the kernel suspends the process. The kernel then saves the 'context' of the process - all the general purpose registers (GPRs), the stack pointer, the next-instruction pointer etc - into a structure called a 'sigframe'. The sigframe is stored on the stack, and then the kernel runs the signal handler. At the very end of the signal handler, it calls a special system call called 'sigreturn' - indicating to the kernel that the signal has been dealt with. The kernel then grabs the sigframe from the stack, restores the process's context and resumes the execution of the process.

This is the rough mental picture you should have:
Double Format

Okay... but you still haven't explained what SROP is..?

Well, if you insist...

The above process was designed so that the kernel does not need to keep track of what signals it has delivered. The kernel assumes that the sigframe it takes off the stack was legitimately put there by the kernel because of a signal. This is where we can trick the kernel!

If we can construct a fake sigframe, put it on the stack, and call sigreturn, the kernel will assume that the sigframe is one it put there before and will load the contents of the fake context into the CPU's registers and 'resume' execution from where the fake sigframe tells it to. And that is what SROP is!

Well that sounds cool, show me!

Firstly we have to set up a (valid) sigframe:

By valid sigframe, I mean a sigframe that the kernel will not reject. Luckily most architectures only examine a few parts of the sigframe to determine the validity of it. Unluckily, you will have to dive into the source code to find out which parts of the sigframe you need to set up for your architecture. Have a look in the function which deals with the syscall sigreturn (probably something like sys_sigreturn() ).

For a real time signal on a little endian powerpc 64bit machine, the sigframe looks something like this:

struct rt_sigframe {
        struct ucontext uc;
        unsigned long _unused[2];
        unsigned int tramp[TRAMP_SIZE];
        struct siginfo __user *pinfo;
        void __user *puc;
        struct siginfo info;
        unsigned long user_cookie;
        /* New 64 bit little-endian ABI allows redzone of 512 bytes below sp */
        char abigap[USER_REDZONE_SIZE];
} __attribute__ ((aligned (16)));

The most important part of the sigframe is the context or ucontext as this contains all the register values that will be written into the CPU's registers when the kernel loads in the sigframe. To minimise potential issues we can copy valid values from the current GPRs into our fake ucontext:

register unsigned long r1 asm("r1");
register unsigned long r13 asm("r13");
struct ucontext ctx = { 0 };

/* We need a system thread id so copy the one from this process */
ctx.uc_mcontext.gp_regs[PT_R13] = r13;

/*  Set the context's stack pointer to where the current stack pointer is pointing */
ctx.uc_mcontext.gp_regs[PT_R1] = r1;

We also need to tell the kernel where to resume execution from. As this is just a test to see if we can successfully get the kernel to resume execution from a fake sigframe we will just point it to a function that prints out some text.

/* Set the next instruction pointer (NIP) to the code that we want executed */
ctx.uc_mcontext.gp_regs[PT_NIP] = (unsigned long) test_function;

For some reason the sys_rt_sigreturn() on little endian powerpc 64bit checks the endianess bit of the ucontext's MSR register, so we need to set that:

/* Set MSR bit if LE */
ctx.uc_mcontext.gp_regs[PT_MSR] = 0x01;

Fun fact: not doing this or setting it to 0 results in the CPU switching from little endian to big endian! For a powerpc machine sys_rt_sigreturn() only examines ucontext, so we do not need to set up a full sigframe.

Secondly we have to put it on the stack:

/* Set current stack pointer to our fake context */
r1 = (unsigned long) &ctx;

Thirdly, we call sigreturn:

/* Syscall - NR_rt_sigreturn */
asm("li 0, 172\n");
asm("sc\n");

When the kernel receives the sigreturn call, it looks at the userspace stack pointer for the ucontext and loads this in. As we have put valid values in the ucontext, the kernel assumes that this is a valid sigframe that it set up earlier and loads the contents of the ucontext in the CPU's registers "and resumes" execution of the process from the address we pointed the NIP to.

Obviously, you need something worth executing at this address, but sadly that next part is not in my job description. This is a nice gateway into the kernel though and would pair nicely with another kernel vulnerability. If you are interested in some more in depth examples, have a read of this paper.

So how can we mitigate this?

Well, I'm glad you asked. We need some way of distinguishing between sigframes that were put there legitimately by the kernel and 'fake' sigframes. The current idea that is being thrown around is cookies, and you can see the x86 discussion here.

The proposed solution is to give every sighand struct a randomly generated value. When the kernel constructs a sigframe for a process, it stores a 'cookie' with the sigframe. The cookie is a hash of the cookie's location and the random value stored in the sighand struct for the process. When the kernel receives a sigreturn, it hashes the location where the cookie should be with the randomly generated number in sighand struct - if this matches the cookie, the cookie is zeroed, the sigframe is valid and the kernel will restore this context. If the cookies do not match, the sigframe is not restored.

Potential issues:

  • Multithreading: Originally the random number was suggested to be stored in the task struct. However, this would break multi-threaded applications as every thread has its own task struct. As the sighand struct is shared by threads, this should not adversely affect multithreaded applications.
  • Cookie location: At first I put the cookie on top of the sigframe. However some code in userspace assumed that all the space between the signal handler and the sigframe was essentially up for grabs and would zero the cookie before I could read the cookie value. Putting the cookie below the sigframe was also a no-go due to the ABI-gap (a gap below the stack pointer that signal code cannot touch) being a part of the sigframe. Putting the cookie inside the sigframe, just above the ABI gap has been fine with all the tests I have run so far!
  • Movement of sigframe: If you move the sigframe on the stack, the cookie value will no longer be valid... I don't think that this is something that you should be doing, and have not yet come across a scenario that does this.

For a more in-depth explanation of SROP, click here.
Tell Me About Petitboot

A Google search for 'Petitboot' brings up results from a number of places, some describing its use on POWER servers, others talking about how to use it on the PS3, in varying levels of detail. I tend to get a lot of general questions about Petitboot and its behaviour, and have had a few requests for a broad "Welcome to Petitboot" blog, suggesting that existing docs deal with more specific topics.. or that people just aren't reading them :)

So today we're going to take a bit of a crash course in the what, why, and possibly how of Petitboot. I won't delve too much into technical details, and this will be focussed on Petitboot in POWER land since that's where I spend most of my time. Here we go!

What

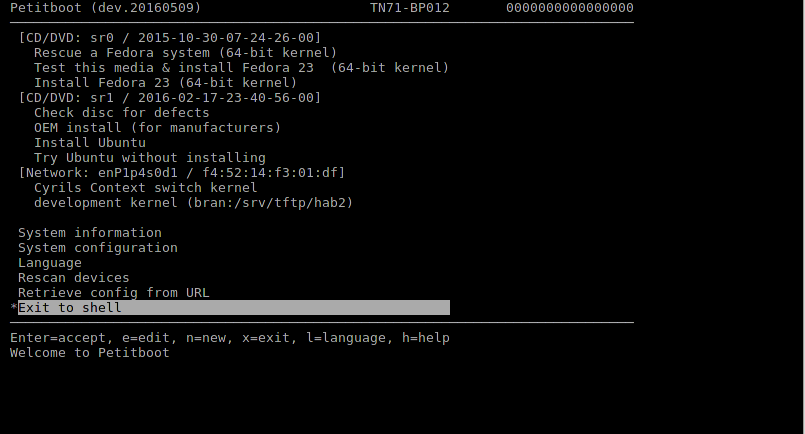
Aside from a whole lot of firmware and kernel logs flying past, the first thing you'll see when booting a POWER serverIn OPAL mode at least... is Petitboot's main menu:

Main Menu

Petitboot is the first interact-able component a user will see. The word 'BIOS' gets thrown around a lot when discussing this area, but that is wrong, and the people using that word are wrong.

When the OPAL firmware layer Skiboot has finished its own set up, it loads a certain binary (stored on the BMC) into memory and jumps into it. This could hypothetically be anything, but for any POWER server right now it is 'Skiroot'. Skiroot is a full Linux kernel and userspace, which runs Petitboot. People often say Petitboot when they mean Skiroot - technically Petitboot is the server and UI processes that happen to run within Skiroot, and Skiroot is the full kernel and rootfs package. This is more obvious when you look at the op-build project - Petitboot is a package built as part of the kernel and rootfs created by Buildroot.

Petitboot is made of two major parts - the UI processes (one for each available console), and the 'discover' server. The discover server updates the UI processes, manages and scans available disks and network devices, and performs the actual booting of host operating systems. The UI, running in ncurses, displays these options, allows the user to edit boot options and system configuration, and tells the server which boot option to kexec.

Why

The 'why' delves into some of the major architectural differences between a POWER machine and your average x86 machine which, as always, could spread over several blog posts and/or a textbook.

POWER processors don't boot themselves, instead the attached Baseboard Management Controller (BMC) does a lot of low-level poking that gets the primary processor into a state where it is ready to execute instructions. PowerVM systems would then jump directly into the PHYP hypervisor - any subsequent OS, be it AIX or Linux, would then run as a 'partition' under this hypervisor.

What we all really want though is to run Linux directly on the hardware, which meant a new boot process would have to be thought up while still maintaining compatibility with PowerVM so systems could be booted in either mode. Thus became OPAL, and its implementation Skiboot. Skipping over so much detail, the system ends up booting into Skiboot which acts as our firmware layer. Skiboot isn't interactive and doesn't really care about things like disks, so it loads another binary into memory and executes it - Skiroot!

Skiroot exists as an alternative to writing a whole new bootloader just for POWER in OPAL mode, or going through the effort to port an existing bootloader to understand the specifics of POWER. Why do all that when Linux already exists and already knows how to handle disks, network interfaces, and a thousand other things? Not to mention that when Linux gains support for fancy new devices so do we, and adding new features of our own is as simple as writing your average Linux program.

Skiroot itself (not including Skiboot) is roughly comparable to UEFI, or at least much more so than legacy BIOS implementations. But whereas UEFI tends to be a monolithic blob of fairly platform-specific code (in practice), Skiroot is simply a small Linux environment that anyone could put together with Buildroot.

A much better insight into the development and motivation behind Skiroot and Petitboot is available in Jeremy's LCA2013 talk

Back to Petitboot

Petitboot is the part of the 'bootloader' that did need to be written, because users probably wouldn't be too thrilled if they had to manually mount disks and kexec their kernels every time they booted the machine. The Petitboot server process mounts any available disk devices and scans them for available operating systems. That's not to say that it scans the entire disk, because otherwise you could be waiting for quite some time, but rather it looks in a list of common locations for bootloader configuration files. This is handy because it means the operating system doesn't need to have any knowledge of Petitboot - it just uses its usual install scripts and Petitboot reads them to know what is available. At the same time Petitboot makes PXE requests on configured network interfaces so we can netboot, and allows these various sources to be given relative priorities for auto-boot, plus a number of other ways to specially configure booting behaviour.

A particularly neat feature of existing in a Linux environment is the ability to easily recover from boot problems; whereas on another system you might need to use a Live CD to fix a misconfiguration or recover a broken filesystem, in Skiroot you can just drop to the shell and fix the issue right there.

In summary, Petitboot/Skiroot is a small but capable Linux environment that every OPAL POWER machine boots into, gathering up all the various local and remote boot possibilities, and presenting them to you in a state-of-the-art ncurses interface. Petitboot updates all the time, and if you come across a feature that you think Petitboot is missing, patches are very welcome at petitboot@lists.ozlabs.org (or hassle me on IRC)!

Doubles in hex and why Kernel addresses ~= -2

It started off a regular Wednesday morning when I hear from my desk a colleague muttering about doubles and their hex representation. "But that doesn't look right", "How do I read this as a float", and "redacted you're the engineer, you do it". My interest piqued, I headed over to his desk to enquire about the great un-solvable mystery of the double and its hex representation. The number which would consume me for the rest of the morning: 0xc00000001568fba0.

That's a Perfectly Valid hex Number!

I hear you say. And you're right, if we were to treat this as a long it would simply be 13835058055641365408 (or -4611686018068186208 if we assume a signed value). But we happen to know that this particular piece of data which we have printed is supposed to represent a double (-2 to be precise). "Well print it as a double" I hear from the back, and once again we should all know that this can be achieved rather easily by using the %f/%e/%g specifiers in our print statement. The only problem is that in kernel land (where we use printk) we are limited to printing fixed point numbers, hence why our only easy option was to print our double in it's raw hex format.

This is the point where we all think back to that university course where number representations were covered in depth, and terms like 'mantissa' and 'exponent' surface in our minds. Of course as we rack our brains we realise there's no way that we're going to remember exactly how a double is represented and bring up the IEEE 754 Wikipedia page.

What is a Double?

Taking a step back for a second, a double (or a double-precision floating-point) is a number format used to represent floating-point numbers (those with a decimal component). They are made up of a sign bit, an exponent and a fraction (or mantissa):

Double Format

Where the number they represent is defined by:

Double Formula

So this means that a 1 in the MSB (sign bit) represents a negative number, and we have some decimal component (the fraction) which we multiply by some power of 2 (as determined by the exponent) to get our value.

Alright, so what's 0xc00000001568fba0?

The reason we're all here to be begin with, so what's 0xc00000001568fba0 if we treat it as a double? We can first split it into the three components:

0xc00000001568fba0:

Sign bit: 1 -> Negative
Exponent: 0x400 -> 2(1024 - 1023)
Fraction: 0x1568fba0 -> 1.something

And then use the formula above to get our number:

(-1)1 x 1.something x 2(1024 - 1023)

But there's a much easier way! Just write ourselves a little program in userspace (where we are capable of printing floats) and we can save ourselves most of the trouble.

#include <stdio.h>

void main(void)
{
    long val = 0xc00000001568fba0;

    printf("val: %lf\n", *((double *) &val));
}

So all we're doing is taking our hex value and storing it in a long (val), then getting a pointer to val, casting it to a double pointer, and dereferencing it and printing it as a float. Drum Roll And the answer is?

"val: -2.000000"

"Wait a minute, that doesn't quite sound right". You're right, it does seem a bit strange that this is exactly -2. Well it may be that we are not printing enough decimal places to see the full result, so update our print statement to:

printf("val: %.64lf\n", *((double *) &val));

And now we get:

"val: -2.0000001595175973534423974342644214630126953125000000"

Much better... But still where did this number come from and why wasn't it the -2 that we were expecting?

Kernel Pointers

At this point suspicions had been raised that what was being printed by my colleague was not what he expected and that this was in fact a Kernel pointer. How do you know? Lets take a step back for a second...

In the PowerPC architecture, the address space which can be seen by an application is known as the effective address space. We can take this and translate it into a virtual address which when mapped through the HPT (hash page table) gives us a real address (or the hardware memory address).

The effective address space is divided into 5 regions:

Effective Address Table

As you may notice, Kernel addresses begin with 0xc. This has the advantage that we can map a virtual address without the need for a table by simply masking the top nibble.

Thus it would be reasonable to assume that our value (0xc00000001568fba0) was indeed a pointer to a Kernel address (and further code investigation confirmed this).

But What is -2 as a Double in hex?

Well lets modify the above program and find out:

include <stdio.h>

void main(void)
{
        double val = -2;

        printf("val: 0x%lx\n", *((long *) &val));
}

Result?

"val: 0xc000000000000000"

Now that sounds much better. Lets take a closer look:

0xc000000000000000:

Sign Bit: 1 -> Negative
Exponent: 0x400 -> 2(1024 - 1023)
Fraction: 0x0 -> Zero

So if you remember from above, we have:

(-1)1 x 1.0 x 2(1024 - 1023) = -2

What about -1? -3?

-1:

0xbff0000000000000:

Sign Bit: 1 -> Negative
Exponent: 0x3ff -> 2(1023 - 1023)
Fraction: 0x0 -> Zero

(-1)1 x 1.0 x 2(1023 - 1023) = -1

-3:

0xc008000000000000:

Sign Bit: 1 -> Negative
Exponent: 0x400 -> 2(1024 - 1023)
Fraction: 0x8000000000000 -> 0.5

(-1)1 x 1.5 x 2(1024 - 1023) = -3

So What Have We Learnt?

Firstly, make sure that what you're printing is what you think you're printing.

Secondly, if it looks like a Kernel pointer then you're probably not printing what you think you're printing.

Thirdly, all Kernel pointers ~= -2 if you treat them as a double.

And Finally, with my morning gone, I can say for certain that if we treat it as a double, 0xc00000001568fba0 = -2.0000001595175973534423974342644214630126953125.

Getting logs out of things

Here at OzLabs, we have an unfortunate habit of making our shiny Power computers very sad, which is a common problem in systems programming and kernel hacking. When this happens, we like having logs. In particular, we like to have the kernel log and the OPAL firmware log, which are, very surprisingly, rather helpful when debugging kernel and firmware issues.

Here's how to get them.

From userspace

You're lucky enough that your machine is still up, yay! As every Linux sysadmin knows, you can just grab the kernel log using dmesg.

As for the OPAL log: we can simply ask OPAL to tell us where its log is located in memory, copy it from there, and hand it over to userspace. In Linux, as per standard Unix conventions, we do this by exposing the log as a file, which can be found in /sys/firmware/opal/msglog.

Annoyingly, the msglog file reports itself as size 0 (I'm not sure exactly why, but I think it's due to limitations in sysfs), so if you try to copy the file with cp, you end up with just a blank file. However, you can read it with cat or less.

From xmon

xmon is a really handy in-kernel debugger for PowerPC that allows you to do basic debugging over the console without hooking up a second machine to use with kgdb. On our development systems, we often configure xmon to automatically begin debugging whenever we hit an oops or panic (using xmon=on on the kernel command line, or the XMON_DEFAULT Kconfig option). It can also be manually triggered:

root@p86:~# echo x > /proc/sysrq-trigger
sysrq: SysRq : Entering xmon
cpu 0x7: Vector: 0  at [c000000fcd717a80]
pc: c000000000085ad8: sysrq_handle_xmon+0x68/0x80
lr: c000000000085ad8: sysrq_handle_xmon+0x68/0x80
sp: c000000fcd717be0
msr: 9000000000009033
current = 0xc000000fcd689200
paca    = 0xc00000000fe01c00   softe: 0        irq_happened: 0x01
pid   = 7127, comm = bash
Linux version 4.5.0-ajd-11118-g968f3e3 (ajd@ka1) (gcc version 5.2.1 20150930 (GCC) ) #1 SMP Tue Mar 22 17:01:58 AEDT 2016
enter ? for help
7:mon>

From xmon, simply type dl to dump out the kernel log. If you'd like to page through the log rather than dump the entire thing at once, use #<n> to split it into groups of n lines.

Until recently, it wasn't as easy to extract the OPAL log without knowing magic offsets. A couple of months ago, I was debugging a nasty CAPI issue and got rather frustrated by this, so one day when I had a couple of hours free I refactored the existing sysfs interface and added the do command to xmon. These patches will be included from kernel 4.6-rc1 onwards.

When you're done, x will attempt to recover the machine and continue, zr will reboot, and zh will halt.

From the FSP

Sometimes, not even xmon will help you. In production environments, you're not generally going to start a debugger every time you have an incident. Additionally, a serious hardware error can cause a 'checkstop', which completely halts the system. (Thankfully, end users don't see this very often, but kernel developers, on the other hand...)

This is where the Flexible Service Processor, or FSP, comes in. The FSP is an IBM-developed baseboard management controller used on most IBM-branded Power Systems machines, and is responsible for a whole range of things, including monitoring system health. Among its many capabilities, the FSP can automatically take "system dumps" when fatal errors occur, capturing designated regions of memory for later debugging. System dumps can be configured and triggered via the FSP's web interface, which is beyond the scope of this post but is documented in IBM Power Systems user manuals.

How does the FSP know what to capture? As it turns out, skiboot (the firmware which implements OPAL) maintains a Memory Dump Source Table which tells the FSP which memory regions to dump. MDST updates are recorded in the OPAL log:

[2690088026,5] MDST: Max entries in MDST table : 256
[2690090666,5] MDST: Addr = 0x31000000 [size : 0x100000 bytes] added to MDST table.
[2690093767,5] MDST: Addr = 0x31100000 [size : 0x100000 bytes] added to MDST table.
[2750378890,5] MDST: Table updated.
[11199672771,5] MDST: Addr = 0x1fff772780 [size : 0x200000 bytes] added to MDST table.
[11215193760,5] MDST: Table updated.
[28031311971,5] MDST: Table updated.
[28411709421,5] MDST: Addr = 0x1fff830000 [size : 0x100000 bytes] added to MDST table.
[28417251110,5] MDST: Table updated.

In the above log, we see four entries: the skiboot/OPAL log, the hostboot runtime log, the petitboot Linux kernel log (which doesn't make it into the final dump) and the real Linux kernel log. skiboot obviously adds the OPAL and hostboot logs to the MDST early in boot, but it also exposes the OPAL_REGISTER_DUMP_REGION call which can be used by the operating system to register additional regions. Linux uses this to register the kernel log buffer. If you're a kernel developer, you could potentially use the OPAL call to register your own interesting bits of memory.

So, the MDST is all set up, we go about doing our business, and suddenly we checkstop. The FSP does its sysdump magic and a few minutes later it reboots the system. What now?

  • After we come back up, the FSP notifies OPAL that a new dump is available. Linux exposes the dump to userspace under /sys/firmware/opal/dump/.

  • ppc64-diag is a suite of utilities that assist in manipulating FSP dumps, including the opal_errd daemon. opal_errd monitors new dumps and saves them in /var/log/dump/ for later analysis.

  • opal-dump-parse (also in the ppc64-diag suite) can be used to extract the sections we care about from the dump:

    root@p86:/var/log/dump# opal-dump-parse -l SYSDUMP.842EA8A.00000001.20160322063051 
    |---------------------------------------------------------|
    |ID              SECTION                              SIZE|
    |---------------------------------------------------------|
    |1              Opal-log                           1048576|
    |2              HostBoot-Runtime-log               1048576|
    |128            printk                             1048576|
    |---------------------------------------------------------|
    List completed
    root@p86:/var/log/dump# opal-dump-parse -s 1 SYSDUMP.842EA8A.00000001.20160322063051 
    Captured log to file Opal-log.842EA8A.00000001.20160322063051
    root@p86:/var/log/dump# opal-dump-parse -s 2 SYSDUMP.842EA8A.00000001.20160322063051 
    Captured log to file HostBoot-Runtime-log.842EA8A.00000001.20160322063051
    root@p86:/var/log/dump# opal-dump-parse -s 128 SYSDUMP.842EA8A.00000001.20160322063051 
    Captured log to file printk.842EA8A.00000001.20160322063051
    

There's various other types of dumps and logs that I won't get into here. I'm probably obliged to say that if you're having problems out in the wild, you should probably contact your friendly local IBM Service Representative...

Acknowledgements

Thanks to Stewart Smith for pointing me in the right direction regarding FSP sysdumps and related tools.

The Elegance of the Plaintext Patch

I've only been working on the Linux kernel for a few months. Before that, I worked with proprietary source control at work and common tools like GitHub at home. The concept of the mailing list seemed obtuse to me. If I noticed a problem with some program, I'd be willing to open an issue on GitHub but not to send an email to a mailing list. Who still uses those, anyway?

Starting out with the kernel meant I had to figure this email thing out. git format-patch and git send-email take most of the pain out of formatting and submitting a patch, which is nice. The patch files generated by format-patch open nicely in Emacs by default, showing all whitespace and letting you pick up any irregularities. send-email means you can send it to yourself or a friend first, finding anything that looks stupid before being exposed to the public.

And then what? You've sent an email. It gets sent to hundreds or thousands of people. Nowhere near that many will read it. Some might miss it due to their mail server going down, or the list flagging your post as spam, or requiring moderation. Some recipients will be bots that archive mail on the list, or publish information about the patch. If you haven't formatted it correctly, someone will let you know quickly. If your patch is important or controversial, you'll have all sorts of responses. If your patch is small or niche, you might not ever hear anything back.

I remember when I sent my first patch. I was talking to a former colleague who didn't understand the patch/mailing list workflow at all. I sent him a link to my patch on a mail archive. I explained it like a pull request - here's my code, you can find the responses. What's missing from a GitHub-esque pull request? We don't know what tests it passed. We don't know if it's been merged yet, or if the maintainer has looked at it. It takes a bit of digging around to find out who's commented on it. If it's part of a series, that's awkward to find out as well. What about revisions of a series? That's another pain point.

Luckily, these problems do have solutions. Patchwork, written by fellow OzLabs member Jeremy Kerr, changes the way we work with patches. Project maintainers rely on Pathwork instances, such as https://patchwork.ozlabs.org, for their day-to-day workflow: tagging reviewers, marking the status of patches, keeping track of tests, acks, reviews and comments in one place. Missing from this picture is support for series and revisions, which is a feature that's being developed by the freedesktop project. You can check out their changes in action here.

So, Patchwork helps patches and email catch up to what GitHub has in terms of ease of information. We're still missing testing and other hooks. What about review? What can we do with email, compared to GitHub and the like?

In my opinion, the biggest feature of email is the ease of review. Just reply inline and you're done. There's inline commenting on GitHub and GitLab, which works well but is a bit tacky, people commenting on the same thing overlap and conflict, each comment generates a notification (which can be an email until you turn that off). Plus, since it's email, it's really easy to bring in additional people to the conversation as necessary. If there's a super lengthy technical discussion in the kernel, it might just take Linus to resolve.

There are alternatives to just replying to email, too, such as Gerrit. Gerrit's pretty popular, and has a huge amount of features. I understand why people use it, though I'm not much of a fan. Reason being, it doesn't add to the email workflow, it replaces it. Plaintext email is supported on pretty much any device, with a bunch of different programs. From the goals of Patchwork: "patchwork should supplement mailing lists, not replace them".

Linus Torvalds famously explained why he prefers email over GitHub pull requests here, using this pull request from Ben Herrenschmidt as an example of why git's own pull request format is superior to that of GitHub. Damien Lespiau, who is working on the freedesktop Patchwork fork, outlines on his blog all the issues he has with mailing list workflows and why he thinks mailing lists are a relic of the past. His work on Patchwork has gone a long way to help fix those problems, however I don't think mailing lists are outdated and superceded, I think they are timeless. They are a technology-agnostic, simple and free system that will still be around if GitHub dies or alienates its community.

That said, there's still the case of the missing features. What about automated testing? What about developer feedback? What about making a maintainer's life easier? We've been working on improving these issues, and I'll outline how we're approaching them in a future post.